About This Personal Weather Station & Website
Ambient WS-2902C OSPREY
Pecan Grove, Richmond, TX
Additional Site Info
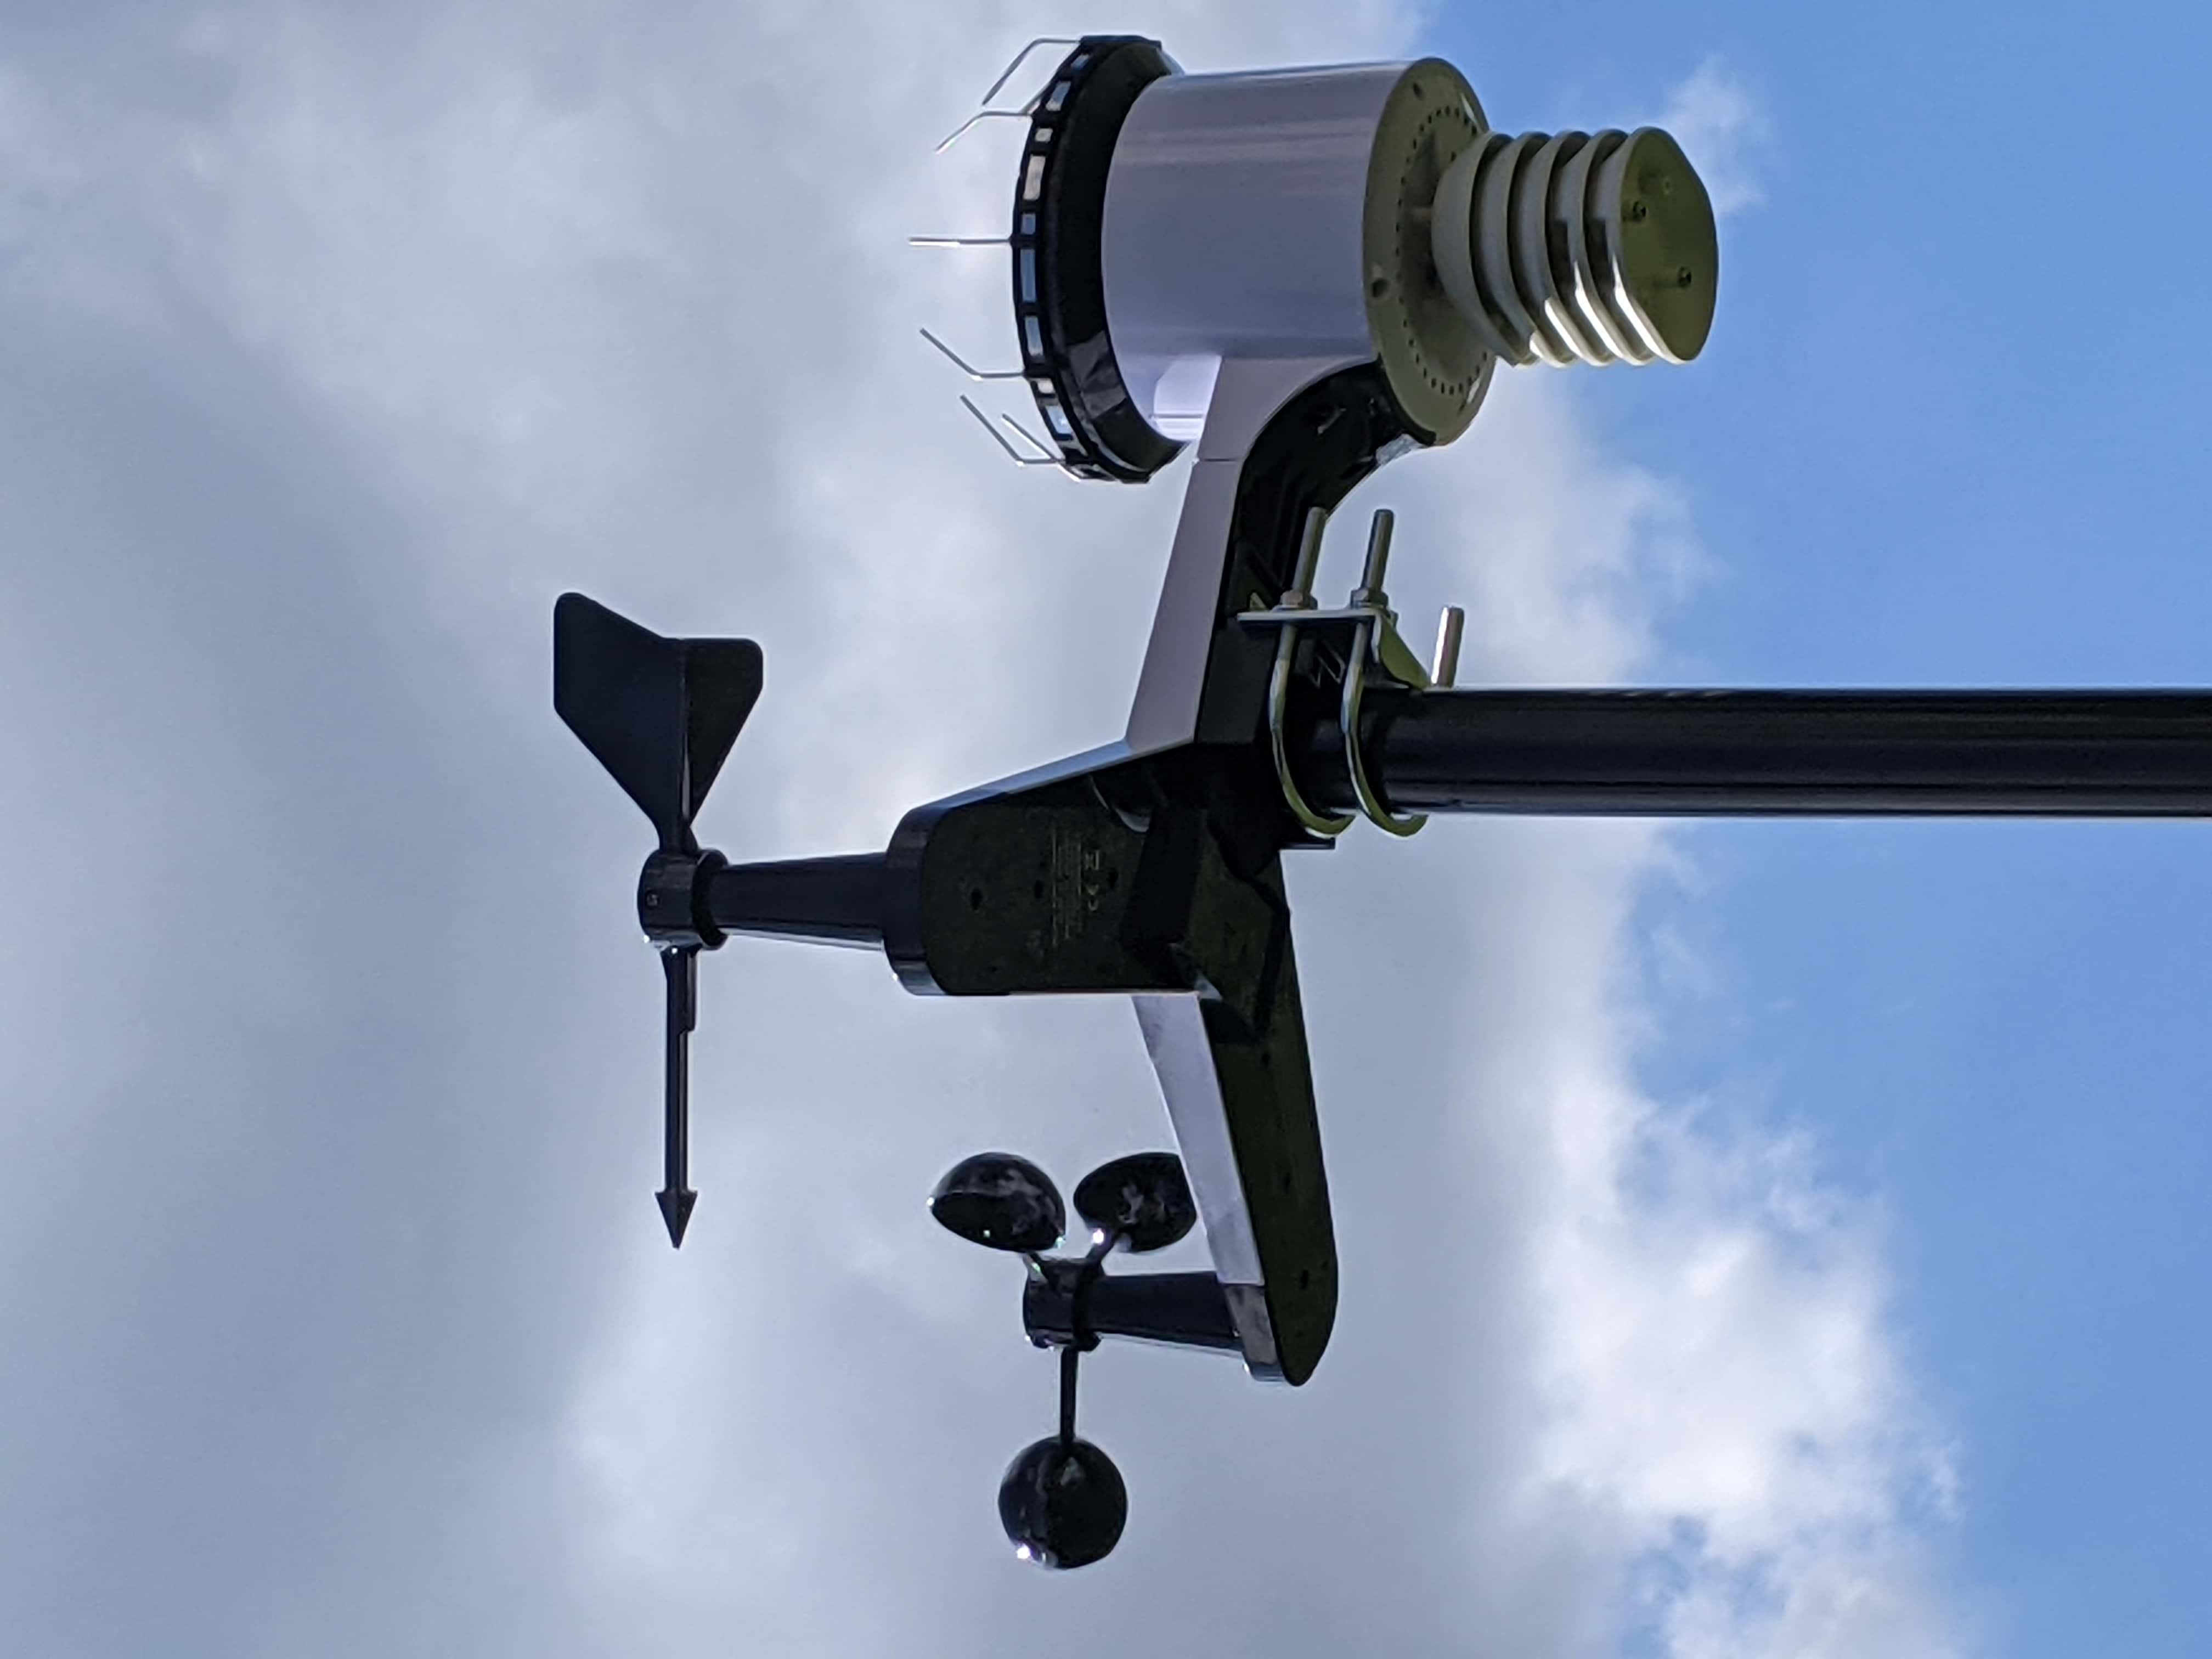
- Station hardware: Ambient Weather WS-2902C
- Server uptime: 17 days, 6 hours, 59 minutes
- WeeWX uptime: 0 days, 1 hour, 41 minutes
- WeeWX version: 4.8.0
- Belchertown Skin Version: 1.3b2
Station Details
Weather Station ID:KTXRICHM303
Station Name: Pecan_8
Station Location: Pecan Grove Plantation-Pecan Golf Course Hole #8
Ground Elevation: 26.0m or 85.3 ft
Outdoor Weather Station Elevation Above Ground: 2.5m / 8.2ft
Indoor Barometric Station Elevation: 27m / 88.58ft
Latitude/Longitude: 29.6331518° N, 95.7408842° W
City:Richmond - State:Texas
Hardware: Ambient Weather Station WS-2902C OSPREY
Software: Weewx with Belchertown skin; Ambient Weather Station Software
Windy.com Maps update every minute
Pecan Grove WX Cams update every minute
WS-2902C Data Update Transmission Periods
| Sensor | Period |
|---|---|
| Wind Speed | 16 Seconds |
| Wind Direction | 16 Seconds |
| Outdoor Temp | 16 Seconds |
| Outdoor Humidity | 16 Seconds |
| Rain Total | 16 Seconds |
| Barometric Pressure | 16 Seconds |
| Solar Radiation | 16 Seconds |
| UV Index | 16 Seconds |
WS-2902C Measurement Specifications
| Measurement | Range | Accuracy | Resolution |
|---|---|---|---|
| Out Temp | -23 to 140 °F | ± 2 °F | 0.1 °F |
| Out Humidity | 0 to 99% | ±5% | 1% |
| Barometric Pressure | 8.85 to 32.50 inHg | ±0.08 inHg (27.13 to 32.50 inHg) | 0.01 inHg |
| Light | 0 to 200,000 Lux | ±15% | 1 Lux |
| Rain | 0 to 394 in. | ±5% | 0.01 in |
| Wind Direction | 0 - 360 º | ±10º | 1º |
| Wind Speed | 0 to 100 mph | ±2.2mph (0-22mph) ±10%>22mph | 1.4 mph |
Site Contributors
Maps by Windy.com
Two embedded views: Rain and Thunder view (embedded in the KTXRICHM303 Current Weather Conditions section at the top); Gulf of Mexico Wind & Isobar view (embedded map after the weather cameras).
7 Day Weather Forecasts
The National Weather Service provides a 7 day forecast from NWS Houston weather office via readings at Bush Intercontinental Airport (IAH).
NWS Houston Area ForecastTickertape forecast above the weather guages on the front page is provided by WeatherUnderground.com
Weather Undergound (WU)AerisWeather provides current observations, a seven day Forecast, cloud cover info, Air Quality data and a weather map. On their webpage at the link below you will find much more info.
AerisWeatherTomorrow.io provides a 6 day forecast widget on this page, and, if you go to their webpage via the supplied link, you will get a 2 week forecast and much more. They also provide AGI and pollen count information widgets located on the AQI tab of this weather website.
Richmond, Texas Weather Forecast by Tomorrow.io Weather API
USGS
USGS provides earthquake data which is set for a radius of 1553 miles around this Pecan Grove location.
Latest EarthquakesWeewx Weather Software
This station is controlled by WeeWx, an experimental weather software. WeeWX is a free, open source, software program, written in Python, which interacts with your weather station to produce graphs, reports, and HTML pages. It can optionally publish to weather sites or web servers. It uses modern software concepts, making it simple, robust, and easy to extend. It includes extensive documentation. WeeWX runs under most versions of Linux, as well as macOS, *BSD, and Solaris. Many users are running on the Raspberry Pi. Thousands of stations throughout the world run WeeWX, many of whom have opted-in to be shown on our station map. Look for this weather station (KTXRICHM303) on the map under 'Pecan Grove.'
SteelSeries WX Gauges
SteelSeries Weewx WX Extension
Real Time Weather Gauges by Mark Crossley,based on the SteelSeries gauges from Han Solo
Belchertown Skin(framework for these web pages)
This skin (or theme, or template) is for the weewx weather software and is modeled after Pat O'Brien's website BelchertownWeather.com. Pat O'Brien of POB LABS is a collaboration systems engineer, freelance web developer and owner of a successful weding photography business. Please visit his website for more info!
Pat O'Brien Labs Pat's Weather PageAbout Me
This web site was customized, built, activated and is hosted by me on my own Webserver. I used html/w3css to program my sections of the site after spending time studying online at w3schools. I'm a telecommunications engineer and have worked in the field for over 40 years. This is something I did just for fun. I enjoy technology and learning new things. Don't forget to visit my other webpages sometime - links are at the bottom of this page. Enjoy!
Here is a great article explaining Solar Radiation.
About Solar RadiationNOAA Info - How to use the UV Index.
About UV IndexUV Index for Richmond,TX
Environmental Info - Enter Zip
CDC Covid Tracker
CDC Intl. Travel
US Holidays
Welcome to the KTXRICHM303 Weather Site
Weather Station KTXRICHM303
KTXRICHM303 weather data is powered by an Ambient weather station, model WS-2902C OSPREY. The station is located in Pecan Grove on the west side of the Pecan course 8th hole near the first bunker. Data from the station is transmitted to the Ambient weather network, Weather Underground, PWSweather.com, CWOP and Windy.com. The weather data on this KTXRICHM303 weather web site is live data from my weather station, as long as you are connected to the web page. Upon connection to the page you will see a yellow dot in the upper left that will indicate a live connection to the ambient weather station is in progress. Once connected it will blink green and and you will see the weather data (temperature, windspeed ...) update about every 16 seconds. In addition the wx cameras and weather radar windows (Windy.com) will refresh every minute without the need to refresh the webpage in the browser. Welcome to live weather data from Pecan Grove, Texas!
CWOP data is used for forecasting data by many organizations including but not limited to NWS, MesoWest and many other government and private organizations. Weather Underground and PWSweather.com are sites that collect data from a multitude of personal weather stations and make it available to tne public. Data from personal weather stations can be used to manage certain automatic intelligent sprinkler systems like those made by Rachio.
Weather Cameras
I have two weather cameras on my wx web page that are now live. There is a slight delay (about 40 seconds) from real time, due to computer processing. These cameras also provide snapshots to the weather site Windy.com. One camera points to the North West across the Pecan course fairways 8 and 2. The other camera points to the South West across the Pecan Grove course fairways 8 and 2. Storms in the summer generally come from the southwest and in the winter from the northwest. A real time snapshot from each camera updated every few minutes is posted on Windy.com. If you go to windy.com via the link on this web page, you will find these wx camera pictures under station KTXRICHM303, and windy.com provides a 24 hour timelapse option as well. This allows visual weather observations over the past 24 hours.
KTXRICHM303 Web Page Contents:
After the current weather conditions in Pecan Grove you will find links to KTXRICHM303 dashboards on Weather Underground, PWS weather.com, AmbientWeather.net, Windy.com and CWOP. Windy.com includes the cameras. This site includes an embedded live Windy.com weather map, which displays the wind view of the Gulf of Mexico area. This is a perfect view to track hurricanes in the Gulf. The views can be changed, and there is a 10 day forcast band that can be selected, if desired. Clicking on either of the two embedded Windy.com weather maps will take you to the Windy.com website where you can get a full screen view with many options. The entire page is powered by weewx, using the belchertown skin (view design template) that I've customized for this Pecan Grove weather station web site.
I have added a second 7 day weather forecast so one can compare forecasts from two different sources. After the snapshots and the second 7 day forecast you will find two RSS news feeds. One news feed is from the National Weather Service which will take you to each of 3 hurricane tracking maps. The second news feed is from GDACS, which tracks worldwide natural disasters like hurricanes, volcanic eruptions, earthquakes, fires etc. After the charts section you will find slideshows of significant weather events experienced in Pecan Grove, Texas. You will also find several links to cameras by ABC13 News KTRK Houston and Houston Transtar highway cameras.
Most of the items on the web page are "clickable" and will take you to the author's web page.
Meteorology Terms:
Note: I am NOT the source of the following technical info. Please see the links for reference material!
Temperature
Heat Index = Temperature with respect to humidity.
Feels Like = Temperature with respect to humidity and windspeed. Also known as Apparent Temperature.
Apparent Temperature = Perceived temperature in degrees Fahrenheit derived from either a combination of temperature and wind (Wind Chill) or temperature and humidity (Heat Index) for the indicated hour. When the temperature at a particular grid point falls to 50 F or less, wind chill will be used for that point for the Apparent Temperature. When the temperature at a grid point rises above 80 F, the heat index will be used for Apparent Temperature. Between 51 and 80 F, the Apparent Temperature will be the ambient air temperature (Source). National Wx Service Iowa State University
Humidity
Relative Humidity = Actual amount of water in the air divided by the saturated amount of moisture that the air can hold at that temperature. It's a function of water content and temperature. Relative humidity indicates how close the combination of temperature and humidity are to saturation, but it does not indicate the amount of moisture in the air.
Absolute Humidity = Absolute humidity (expressed as grams of water vapor per cubic meter volume of air) is a measure of the actual amount of water vapor (moisture) in the air, regardless of the air's temperature.
Vapor Pressure = Actual vapor pressure is a measurement of the amount of water vapor in a volume of air and increases as the amount of water vapor increases.
Saturation Vapor Pressure = The saturation vapour pressure is the pressure at which water vapour is in thermodynamic equilibrium with its condensed state. The vapor pressure at which the gaseous phase of a substance can coexist with the liquid or solid phase in equilibrium at a given temperature. At pressures higher than saturation vapor pressure, water would condense, whilst at lower pressures it would evaporate or sublimate. The saturation vapor pressure of water increases with increasing temperature.
Dew Point = The temperature the air needs to be cooled to (at constant pressure) in order to achieve a relative humidity (RH) of 100% (fully saturated). At this point the air cannot hold more water in the gas form. The higher the dewpoint, the greater the amount of moisture is in the air and the muggier it will feel. Generally during summer dewpoints less than 55 are comfortable, greater than 55 but less than 65 are sticky&humid, greater than 65 = muggy, and greater than 70 = tropical. Dewpoint is considered a more accurate way to evaluate humidity & comfort level than relative humidity, because it is an absolute measurement that indicates the amount of moisture in the air. When dewpoint=temperature the relative humidity=100% and condensation will form, if the temperature drops. Warmer air can hold more moisture. This is why for example at 40F with a depoint=40F the humidity=100%, but it feels much better than 85F with dewpoint=60F which = humidity of 43%. Air with a lower dewpoint is drier than air with a higher dewpoint.
Cloud Base Calculation = A cloud base (or the base of the cloud) is the lowest altitude of the visible portion of a cloud. 1) Calculate the ‘spread,’ where you’re taking the current temperature and subtracting the dew point. 2) Divide the spread by 4.4 (if temperatures are in °F) or 2.5 (if temperatures are in °C), then multiply by 1000. Add the results from step (2) to the field elevation to obtain the altitude of the cloud base above mean sea level.
When air near the ground is humid, cloud base (bottom of clouds) is low for convective clouds. Drier air has higher cloud bases. Here is why. Cumuliform clouds or convective clouds are formed by warm air rising from near the earth's surface. Picture a blob of rising air called an air parcel. As the air parcel rises, it carries its heat and water molecules with it. But as the air parcel rises, it is moving into altitudes with lower pressure than where it started (because pressure is lower at higher altitudes in the atmosphere). This air parcel expands in the lower pressure, and the expansion causes the air parcel to cool. This process is called adiabatic cooling, because the temperature changes even though there is no heat added or removed from the air parcel (i.e. it is undergoing an adiabatic process). The adiabatic cooling rate for non-cloud air is 9.8 degC for each 1 km of air parcel rise. But colder air can hold less water as vapor than can warmer air. As the air parcel rises and cools adiabatically, its temperature decreases. Eventually, an altitude is reached where the air parcel is so cold that it can just barely hold the water vapor that it is carrying. This is cloud base, because if the air parcel rises any further, then only a portion of the water molecules could still be held as vapor, forcing the remaining molecules to condense into cloud droplets.
This is a calculation and does not necessarily mean there are clouds outside. When there are clouds this calculation provides a good estimate of the location of the cloud base.
Reference for Experts Cloudbase Calc NOAA NWS Clouds Clouds in AviationET & The Water Cycle
Evapotranspiration = ET is the sum of all processes by which water moves from the land surface to the atmosphere via evaporation and transpiration. Evapotranspiration includes water evaporation into the atmosphere from the soil surface, evaporation from the capillary fringe of the groundwater table, and evaporation from water bodies on land. Evapotranspiration also includes transpiration, which is the water movement from the soil to the atmosphere via plants. Transpiration occurs when plants take up liquid water from the soil and release water vapor into the air from their leaves. There are some smart irrigation controllers that can be used to automatically adjust the irrigation schedule based on the ET. The best controllers use accurate local weather information to produce the ET value to be used for irrigation scheduling. Evapotranspiration is a main component of the water cycle and is important in crop maintenance. Evapotranspiration (ET) on this site is a daily sum measured in inches. Meteorological factors determining ET include Solar radiation, Air temperature, Air humidity, and Wind speed. One example of ET use for irrigation management via a contoller is Rachio. See the Rachio links below for more info.
Evapotranspiration 101 USGS Water Science Wikipedia-Good Summary USGS ET & Water Mapping ET Basics for Wine Growers Rachio's Use of ET for Flex Scheds Rachio Wx Intelligence+Air (Barometric) Pressure
Air Pressure = The air pressure at sea level at a temperature of 59°F (15°C) is equal to one atmosphere (Atm). This is the baseline reading for determining relative pressure at any elevation. Atmospheric pressure is also known as barometric pressure because it is measured using a barometer.
Absolute Pressure = The actual air pressure read at any elevation above, at or below Sea Level (the baseline).
Relative Pressure = Absolute Pressure corrected for sea level conditions ('relative' to sea level). To compare pressure conditions from one location to another, meteorologists correct the measured pressure (referred to as absolute pressure) to sea-level conditions.
Wind
Wind Run = Total distance (or amount) of the traveled wind over a period of time. Wind run can help to determine the rate of evaporation of moisture over a particular area. Higher wind runs generate larger ocean waves. Wind run data helps in the placement of wind turbines. The higher the wind run the higher the wind speed will be over the observed period of time.
Daily Wind Run = an indication of the average wind speed over the previous 24 hours. 240miles average wind run over a 24 hour period means a 10mph mean windspeed. This weather station records wind run over a 5 minute interval, as well as an odometer reading of total daily wind run in miles.
Wind Chill = The portion of the cooling of a human body caused by air motion. Wind chill is undefined for temperatures above 50ºF (10ºC). If the temperature is higher, wind doesn't have much effect on apparent temperature.
GTS and GDD - Graphs Section under "Climate."
Grassland Temperature Sum =GTS is used particularly in agricultural meteorology and is therefore also of interest to allotment gardeners. It is based on the daily average temperature, as growing degree day is. The base temperature is 0 degrees centigrade (32 degrees Fahrenheit).It is calculated from all positive daily mean temperature values. Early months are weighted. In January this value is multiplied by 0.5 and in February by 0.75. From March, the full daily value is included in the bill. If the 200 mark is exceeded in spring when calculated in Centigrade (392F), sustainable vegetation begins. It means that spring growing season has begun. Above this limit, the soil can absorb and process enough nitrogen again. The value given in the table is calculated up to May 31st.
Growing Degree Days =GDD are important in agriculture. With this, various phenological phenomena of plants can be predicted and determined. The value is calculated from the average of daily minimum and maximum temperatures in difference to the base value of 10°C.
W/m² & Lux
W/m² or Watts per meter squared = A watt is measurement of power, or the amount of energy that something generates or uses over time. W/m² is the amount of energy received over the surface area of 1 square meter. One watt is equivalent to electricity flowing at a rate of one joule (unit of energy) per second. Relative to electromagnetism, one watt is the rate at which electrical work is performed when a current of one ampere (A) flows across an electrical potential difference of one volt (V). One kilowatt per square meter is equal to 1000 watt/meter².
Lux or Unit of Illuminance = is a measure of the intensity, as perceived by the human eye, of light that hits or passes through a surface. One Lux is equal to one Lumen per square meter. A flux of 1000 lumens, spread uniformly over an area of 1 square metre, lights up that square metre with an illuminance of 1000 lux.
The human eye is most sensitive to light at a frequency of 555nm (green). At this wavelenght 1 lux = 1.464 mW/m2 or 683.002 lux per W/m2 (or lumens per watt) at this wavelength. Solar Radiation is a shorter wave length and different color spectrum, so it has a different factor of Lux to W/m2. Bright sunlight is approximately 136000 lux = 1075 W/m2 = 126.7. The LUX meter is used to measure visible part of the incident solar radiation. multiply lux to 0.0079 which give you value of w/m2. (see the ambient link below)
Ambient Wx Support NASA on Sunlight Solar Resource Maps & DataTwiight
Civil Dawn/Dusk = The Sun is between 6 degrees below the horizon and sunrise/sunset. This twilight phase is the brightest. As the Earth's atmosphere scatters and reflects much of the Sun's rays, coloring the sky bright yellow and orange, artificial lighting is generally not required in clear weather conditions to carry out most outdoor activities. In Houston civil twilight starts about 25-30 minutes before/after sunrise/sunset, depending on the time of year.
Nautical Dawn/Dusk = The moment when the geometric center of the Sun is between 12 and 6 degrees below the horizon. Many of the brighter stars can also be seen, making it possible to use the position of the stars in relation to the horizon to navigate at sea. In Houston nautical twilight starts an hour before/after sunrise/sunset, depending on the time of year.
Astronomical Dawn/Dusk = The geometric center of the Sun's disk is between 12 and 18 degrees below the horizon. To the naked eye, and especially in areas with light pollution, it may be difficult to distinguish astronomical twilight from night time. Most stars and other celestial objects can be seen during this phase. However, astronomers may be unable to observe some of the fainter stars and galaxies as long as the Sun is less than 18 degrees below the horizon—hence the name of this twilight phase. In Houston astronomical twilight starts about an hour and 25 minutes before/after sunrise/sunset, depending on the time of year.
Unit Conversion
1 km = 0.62137119 mi
1 mi = 1.609344 km
1 km/h = 1.150779 mph
1 mph = 0.868976 km/h
0°F = -17.78°C
32°F = 0°C
98.6°F = 37°C
°C = (°F - 32)/1.8000